December 2019

Learning objectives

t-tests seen as linear regression

garden A & B

t-tests seen as linear regression

garden A & C

t-test = linear models

does the difference in intercept ≠ 0

# no Welch correction
t.test(ozone ~ garden, 
       data = gardenAC,
       var.equal = TRUE) 
    Two Sample t-test

data:  ozone by garden
t = -1.6036, df = 18, p-value = 0.1262
alternative hypothesis: true difference in means is not equal to 0
95 percent confidence interval:
 -4.6203102  0.6203102
sample estimates:
mean in group gardenA mean in group gardenC 
                    3                     5 

note that \(-1.6036^2 = 2.571\)

lm(ozone ~ garden,
   data = gardenAC) %>%
  tidy()
# A tibble: 2 x 5
  term          estimate std.error statistic p.value
  <chr>            <dbl>     <dbl>     <dbl>   <dbl>
1 (Intercept)       3        0.882      3.40 0.00318
2 gardengardenC     2.00     1.25       1.60 0.126  
# A tibble: 1 x 7
  r.squared adj.r.squared sigma statistic p.value    df df.residual
      <dbl>         <dbl> <dbl>     <dbl>   <dbl> <int>       <int>
1     0.125        0.0764  2.79      2.57   0.126     2          18

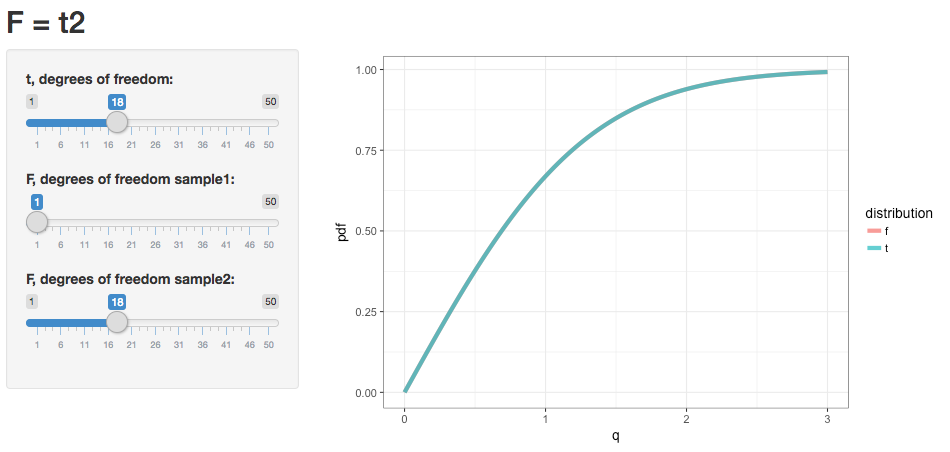
F = t square for simple linear regression

tibble(q = seq(0, 3, length.out = 100),
       t = (pt(q, df = 18) * 2) - 1,
       f = pf((q)^2, df1 = 1,
              df2 = 18)) %>%
  pivot_longer(names_to = "distribution", 
               values_to = "pdf", 
               cols = -q) %>%
  ggplot(aes(q)) +
  geom_line(aes(y = pdf,
                colour = distribution),
            size = 2, alpha = 0.75) +
  theme(legend.position = c(0.8, 0.2))

F & t square in a shiny app

For categorical data, R create a dummy variable based on factors

the (Intercept) term is the mean of the first level

gardenAC %>% 
  mutate(dummy = if_else(garden == "gardenA", 0, 1)) %>%
  lm(ozone ~ dummy, data = .) %>% tidy()
# A tibble: 2 x 5
  term        estimate std.error statistic p.value
  <chr>          <dbl>     <dbl>     <dbl>   <dbl>
1 (Intercept)     3        0.882      3.40 0.00318
2 dummy           2.00     1.25       1.60 0.126  

original dummy coding

tidy(lm(ozone ~ garden,
        data = gardenAC))
# A tibble: 2 x 5
  term          estimate std.error statistic p.value
  <chr>            <dbl>     <dbl>     <dbl>   <dbl>
1 (Intercept)       3        0.882      3.40 0.00318
2 gardengardenC     2.00     1.25       1.60 0.126  

Using factors

forcats

see if we inverse the dummy coding

gardenAC %>% 
  mutate(dummy = if_else(garden == "gardenA", 1, 0)) %>%
  lm(ozone ~ dummy, data = .) %>% tidy()
# A tibble: 2 x 5
  term        estimate std.error statistic   p.value
  <chr>          <dbl>     <dbl>     <dbl>     <dbl>
1 (Intercept)        5     0.882      5.67 0.0000223
2 dummy             -2     1.25      -1.60 0.126    

using fct_relevel()

gardenAC %>% 
  mutate(garden = fct_relevel(garden, "gardenC")) %>%
  lm(ozone ~ garden, data = .) %>%
  tidy()
# A tibble: 2 x 5
  term          estimate std.error statistic   p.value
  <chr>            <dbl>     <dbl>     <dbl>     <dbl>
1 (Intercept)          5     0.882      5.67 0.0000223
2 gardengardenA       -2     1.25      -1.60 0.126    

ANOVA

ANalysis Of VAriance

ANOVA

response

is still continous

but predictors

are categorical

Goal: compare 2 or more means

  • one-way: one categorical variable
  • two-ways: 2 categorical variables
  • three-ways: 3 categorical variables
  • interactions between predictors possible. Actually, they are just linear models

ANOVA

assumptions

residuals normally distributed

although robust as long as sample sizes and variances are equal

equal variance

  • var should stay in a 3:1 ratio
  • Bartlett test (bartlett.test())
  • transform otherwise

independence

between levels

non-parametric alternative: Kruskal-Wallis test (kruskal.test())

one-way ANOVA with 2 levels = linear model

using lm()

lm(ozone ~ garden, data = gardenAC) %>%
  tidy()
# A tibble: 2 x 5
  term          estimate std.error statistic p.value
  <chr>            <dbl>     <dbl>     <dbl>   <dbl>
1 (Intercept)       3        0.882      3.40 0.00318
2 gardengardenC     2.00     1.25       1.60 0.126  

R function for computing an ANOVA is aov()

aov(ozone ~ garden, data = gardenAC) %>%
  tidy()
# A tibble: 2 x 6
  term         df sumsq meansq statistic p.value
  <chr>     <dbl> <dbl>  <dbl>     <dbl>   <dbl>
1 garden        1  20.0  20.0       2.57   0.126
2 Residuals    18 140.    7.78     NA     NA    

ANOVA with a factor with 2 levels

\[F = \frac{variance\; between}{variance\; within}\]

Variance within

SSY

Overall variation, total sum of squares SSY

Variance within

SSY

Overall variation, total sum of squares SSY

Variance between

SSE

Variance between, the error sum of squares SSE

Variance between

SSE

Variance between, the error sum of squares SSE

Analysis of variance works as

when means are significantly different, then the sum of squares computed from the individual treatment means will be smaller than the sum of squares computed from the overall mean M. Crawley

Total variance = explained variance (main effect) + unexplained variance

\[SSY = SSA + SSE\]

\(SSA\) is unknown, and need to be computed by \(SSY - SSE\)

ANOVA detailed

total and unexplained variation

SSY, total variance

SSY <- gardenAB %>%
  ungroup() %>%
  summarise(SSY = sum((ozone - mean(ozone))^2))
SSY
# A tibble: 1 x 1
    SSY
  <dbl>
1    44

SSE, unexplained variance

SSE <- gardenAB %>%
  group_by(garden) %>%
  summarise(SS = sum((ozone - mean(ozone))^2)) %>%
  pull(SS) %>% sum()
SSE
[1] 24

The question now is ’how much of this 44 is attributable to differences between means of A & B (SSA = explained variation) and how much is sampling error (SSE = unexplained variation) Michael J. Crawley

ANOVA detailed

explained variation

treatment is the main effect: SSA

i.e the total variation minus the individual errors.

(SSA <- 44 - (12 + 12))
[1] 20

ANOVA table

Source Sum of Squares Degrees of freedom Mean Square F ratio
Garden (SSA) 20 1 (#levels -1) 20 15
Error (SSE) 24 18 (n - #levels) 1.33333 (= s^2) NA
Total (SSY) 44 19 NA NA

Mean Square = Sum of Squares / degrees of freedom

\(s^2\) stands for residual mean square

\[F = \frac{Explained\; by\; effect}{Unexplained} = \frac{\bar{var}(SSA)}{\bar{var}(SSE)}\]

ANOVA test

  • we observe a F ratio of 15.

Look up the F table for critical value, note that is a one-tail test

one-tail test

qf(0.95, df1 = 1, df2 = 18) 
[1] 4.413873

How much significant?

1 - pf(15, df1 = 1, df2 = 18)
[1] 0.001114539

ANOVA in R

summary(aov(ozone ~ garden, data = gardenAB))
            Df Sum Sq Mean Sq F value  Pr(>F)   
garden       1     20  20.000      15 0.00111 **
Residuals   18     24   1.333                   
---
Signif. codes:  0 '***' 0.001 '**' 0.01 '*' 0.05 '.' 0.1 ' ' 1

all we know is that treatment has a significant effet, the means are different. To display all factors, use summary.lm

linear regression formula

\[ Y = \beta_0 + \beta_1 x_1\]

where \(x_1\) is continuous

ANOVA, the equation becomes

\[ Y = \beta_0 + \beta_{11} x_{11} + \beta_{12} x_{12} \]

where \(x_{11}\) and \(x_{12}\) are dummies for each levels of the factor \(x_1\)

Remember: in R

the (Intercept) term is the mean of the first level, i.e. \(\beta_0 + \beta_{11} x_{11}\)

ANOVA seen as a linear regression

summary.lm(aov())

Call:
aov(formula = ozone ~ garden, data = gardenAB)

Residuals:
   Min     1Q Median     3Q    Max 
    -2     -1      0      1      2 

Coefficients:
              Estimate Std. Error t value Pr(>|t|)    
(Intercept)     3.0000     0.3651   8.216 1.67e-07 ***
gardengardenB   2.0000     0.5164   3.873  0.00111 ** 
---
Signif. codes:  0 '***' 0.001 '**' 0.01 '*' 0.05 '.' 0.1 ' ' 1

Residual standard error: 1.155 on 18 degrees of freedom
Multiple R-squared:  0.4545,    Adjusted R-squared:  0.4242 
F-statistic:    15 on 1 and 18 DF,  p-value: 0.001115
garden mean
gardenA 3
gardenB 5
  • (Intercept) is mean(level1) = mean(gardenA) = 3
  • mean(gardenB) = mean(gardenA) + 2 = 5

gardengardenB is seen as the difference between means

ANOVA seen as a linear regression

3 levels, t.test is out

Call:
aov(formula = ozone ~ garden, data = .)

Residuals:
   Min     1Q Median     3Q    Max 
 -4.00  -1.75   0.00   1.00   6.00 

Coefficients:
              Estimate Std. Error t value Pr(>|t|)    
(Intercept)     3.0000     0.7503   3.998 0.000444 ***
gardengardenB   2.0000     1.0611   1.885 0.070258 .  
gardengardenC   2.0000     1.0611   1.885 0.070258 .  
---
Signif. codes:  0 '***' 0.001 '**' 0.01 '*' 0.05 '.' 0.1 ' ' 1

Residual standard error: 2.373 on 27 degrees of freedom
Multiple R-squared:  0.1493,    Adjusted R-squared:  0.08624 
F-statistic: 2.368 on 2 and 27 DF,  p-value: 0.1128
garden mean
gardenA 3
gardenB 5
gardenC 5
  • (Intercept) still mean(level1)
  • next estimates are relative the 1st level

F tells the 3 means are not different

ANOVA summary table

3 levels

Df Sum Sq Mean Sq F value Pr(>F)
2 26.667 13.333 2.368 0.113
27 152.000 5.630 NA NA

two-ways ANOVA

quinn example

variables

  • density of adult limpets (patella)
  • during 2 seasons
  • record egg mass production
  • at intertidal phase
  • in triplicate
  • link: quinn dataset
  • mind reading the factors…

source: Murray Logan 2009 inspired by Quinn and Keough 2002

two-ways ANOVA

questions

questions

  • is the egg production affected by the adult density?
  • is the egg production affected by season?
  • is the egg production affected by the adult density similarly at all seasons?

source: Murray Logan 2009 inspired by Quinn and Keough 2002

translate in R formula

two-ways ANOVA, limpets

answers

  • is the egg production affected by the adult density?
  • is the egg production affected by season?
  • is the egg production affected by the adult density similarly at all seasons?
aov(EGGS ~ DENSITY * SEASON, data = quinn) %>% 
  summary()
               Df Sum Sq Mean Sq F value   Pr(>F)    
DENSITY         3  5.284   1.761   9.669 0.000704 ***
SEASON          1  3.250   3.250  17.842 0.000645 ***
DENSITY:SEASON  3  0.165   0.055   0.301 0.823955    
Residuals      16  2.915   0.182                     
---
Signif. codes:  0 '***' 0.001 '**' 0.01 '*' 0.05 '.' 0.1 ' ' 1
  • yes, egg production depends on the adult density
  • yes, egg production depends on season
  • the effect of adult density is consistent across seasons

two-ways ANOVA, limpets

diagnostic plot

  • from the anova model:
    • get the residuals
    • get fitted values
    • one function from broom does it well
  • plot residuals ~ fitted
  • visible trends?

two-ways ANOVA, limpets

diagnostic plot

aov(EGGS ~ DENSITY * SEASON,
    data = quinn) %>%
  augment() %>%
  ggplot(aes(.fitted, .resid)) + 
  geom_point() +
  geom_smooth(method = "loess")

satisfactory?

yes, no visible trends

two-ways ANOVA

limpets, final plot

final plot

  • from the anova model:
    • get fitted values
    • get the std error of fitted (default, not computed)
  • plot DENSITY ~ fitted, colored by SEASON
    • joined by a line
    • add std error on each fitted point
  • do you observe an interaction between predictors?

two-ways ANOVA

limpets, final plot

Using predicted EGG production

aov(EGGS ~ DENSITY * SEASON,
    data = quinn) %>%
  augment(se_fit = TRUE) %>%
  ggplot(aes(DENSITY, .fitted,
             colour = SEASON)) + 
  geom_pointrange(aes(ymin = .fitted - .se.fit,
                      ymax = .fitted + .se.fit)) +
  geom_line(aes(group = SEASON)) +
  theme(legend.justification = c(1, 1),
        legend.position = c(.9, .9))

note that parallel lines = no interaction

using means

quinn %>% group_by(DENSITY, SEASON) %>% 
  summarise(M_PROD = mean(EGGS)) %>%
  ggplot() +
  geom_tile(aes(x = DENSITY, y = SEASON,
                fill = M_PROD)) +
  scale_fill_viridis_c() +
  scale_x_discrete(expand = c(0, 0)) +
  scale_y_discrete(expand = c(0, 0))

using ANOVA

aov(EGGS ~ DENSITY * SEASON, data = quinn) %>%
  augment() %>%
  ggplot() +
  geom_tile(aes(x = DENSITY, y = SEASON, 
                fill = .fitted)) +
  scale_fill_viridis_c() +
  scale_x_discrete(expand = c(0, 0)) +
  scale_y_discrete(expand = c(0, 0))

how can we know which mean-comparisons are significant?

Limitations of signifiance

When we conclude that a term is signifiant, all we know is that the means are different between levels. We may be interested in knowing which mean is lower/higher

lm(EGGS ~ DENSITY * SEASON, data = quinn) %>% summary()
Call:
lm(formula = EGGS ~ DENSITY * SEASON, data = quinn)

Residuals:
    Min      1Q  Median      3Q     Max 
-0.6667 -0.2612 -0.0610  0.2292  0.6647 

Coefficients:
                       Estimate Std. Error t value Pr(>|t|)    
(Intercept)             2.41667    0.24642   9.807  3.6e-08 ***
DENSITY15              -0.23933    0.34849  -0.687  0.50206    
DENSITY30              -0.85133    0.34849  -2.443  0.02655 *  
DENSITY45              -1.21700    0.34849  -3.492  0.00301 ** 
SEASONsummer           -0.58333    0.34849  -1.674  0.11358    
DENSITY15:SEASONsummer -0.41633    0.49284  -0.845  0.41069    
DENSITY30:SEASONsummer -0.17067    0.49284  -0.346  0.73363    
DENSITY45:SEASONsummer -0.02367    0.49284  -0.048  0.96229    
---
Signif. codes:  0 '***' 0.001 '**' 0.01 '*' 0.05 '.' 0.1 ' ' 1

Residual standard error: 0.4268 on 16 degrees of freedom
Multiple R-squared:  0.749, Adjusted R-squared:  0.6392 
F-statistic: 6.822 on 7 and 16 DF,  p-value: 0.000745
# same with: summary.lm(aov(EGGS ~ DENSITY * SEASON, data = quinn))

post-hoc tests

raw output

Tukey Honest Significant Diff

aov(EGGS ~ DENSITY * SEASON, data = quinn) %>% TukeyHSD()
  Tukey multiple comparisons of means
    95% family-wise confidence level

Fit: aov(formula = EGGS ~ DENSITY * SEASON, data = quinn)

$DENSITY
            diff        lwr         upr     p adj
15-8  -0.4475000 -1.1525067  0.25750672 0.3020713
30-8  -0.9366667 -1.6416734 -0.23165995 0.0076800
45-8  -1.2288333 -1.9338401 -0.52382662 0.0006998
30-15 -0.4891667 -1.1941734  0.21584005 0.2342310
45-15 -0.7813333 -1.4863401 -0.07632662 0.0273273
45-30 -0.2921667 -0.9971734  0.41284005 0.6441191

$SEASON
                diff      lwr        upr     p adj
summer-spring -0.736 -1.10538 -0.3666196 0.0006453

$`DENSITY:SEASON`
                          diff        lwr         upr     p adj
15:spring-8:spring  -0.2393333 -1.4458501  0.96718341 0.9962324
30:spring-8:spring  -0.8513333 -2.0578501  0.35518341 0.2856238
45:spring-8:spring  -1.2170000 -2.4235167 -0.01048326 0.0472578
8:summer-8:spring   -0.5833333 -1.7898501  0.62318341 0.7025671
15:summer-8:spring  -1.2390000 -2.4455167 -0.03248326 0.0419597
30:summer-8:spring  -1.6053333 -2.8118501 -0.39881659 0.0054858
45:summer-8:spring  -1.8240000 -3.0305167 -0.61748326 0.0016303
30:spring-15:spring -0.6120000 -1.8185167  0.59451674 0.6546904
45:spring-15:spring -0.9776667 -2.1841834  0.22885008 0.1613268
8:summer-15:spring  -0.3440000 -1.5505167  0.86251674 0.9699272
15:summer-15:spring -0.9996667 -2.2061834  0.20685008 0.1450778
30:summer-15:spring -1.3660000 -2.5725167 -0.15948326 0.0208894
45:summer-15:spring -1.5846667 -2.7911834 -0.37814992 0.0061579
45:spring-30:spring -0.3656667 -1.5721834  0.84085008 0.9587034
8:summer-30:spring   0.2680000 -0.9385167  1.47451674 0.9925771
15:summer-30:spring -0.3876667 -1.5941834  0.81885008 0.9446738
30:summer-30:spring -0.7540000 -1.9605167  0.45251674 0.4194243
45:summer-30:spring -0.9726667 -2.1791834  0.23385008 0.1652262
8:summer-45:spring   0.6336667 -0.5728501  1.84018341 0.6178730
15:summer-45:spring -0.0220000 -1.2285167  1.18451674 1.0000000
30:summer-45:spring -0.3883333 -1.5948501  0.81818341 0.9442053
45:summer-45:spring -0.6070000 -1.8135167  0.59951674 0.6631287
15:summer-8:summer  -0.6556667 -1.8621834  0.55085008 0.5803457
30:summer-8:summer  -1.0220000 -2.2285167  0.18451674 0.1300342
45:summer-8:summer  -1.2406667 -2.4471834 -0.03414992 0.0415823
30:summer-15:summer -0.3663333 -1.5728501  0.84018341 0.9583182
45:summer-15:summer -0.5850000 -1.7915167  0.62151674 0.6998230
45:summer-30:summer -0.2186667 -1.4251834  0.98785008 0.9978410
  • what p adj means / why?
  • which correction is used?

post-hoc tests

brooming & filtering

tidy anova and filter relevant

aov(EGGS ~ DENSITY * SEASON, data = quinn) %>%
  TukeyHSD() %>% 
  tidy() %>%
  arrange(adj.p.value) %>%
  filter(adj.p.value < 0.05)
# A tibble: 11 x 6
   term          comparison         estimate conf.low conf.high adj.p.value
   <chr>         <chr>                 <dbl>    <dbl>     <dbl>       <dbl>
 1 SEASON        summer-spring        -0.736    -1.11   -0.367     0.000645
 2 DENSITY       45-8                 -1.23     -1.93   -0.524     0.000700
 3 DENSITY:SEAS… 45:summer-8:spring   -1.82     -3.03   -0.617     0.00163 
 4 DENSITY:SEAS… 30:summer-8:spring   -1.61     -2.81   -0.399     0.00549 
 5 DENSITY:SEAS… 45:summer-15:spri…   -1.58     -2.79   -0.378     0.00616 
 6 DENSITY       30-8                 -0.937    -1.64   -0.232     0.00768 
 7 DENSITY:SEAS… 30:summer-15:spri…   -1.37     -2.57   -0.159     0.0209  
 8 DENSITY       45-15                -0.781    -1.49   -0.0763    0.0273  
 9 DENSITY:SEAS… 45:summer-8:summer   -1.24     -2.45   -0.0341    0.0416  
10 DENSITY:SEAS… 15:summer-8:spring   -1.24     -2.45   -0.0325    0.0420  
11 DENSITY:SEAS… 45:spring-8:spring   -1.22     -2.42   -0.0105    0.0473  

post-hoc tests

plot

snake plot

  • from the Tukey post-hoc tests
  • tidy them
  • sort comparison by estimate
  • plot estimate ~ comparison
  • pointrange estimate +/- CI
  • color by < 0.05 TRUE/FALSE
  • add a dashed horizontal line at y = 0
  • consider flipping axes for readability

post-hoc tests

plotting

tidy data.frame

aov(EGGS ~ DENSITY * SEASON, data = quinn) %>%
  TukeyHSD() %>% 
  tidy() %>%
  ggplot(aes(x = fct_reorder(comparison, 
                             estimate), 
             y = estimate)) +
  geom_pointrange(aes(ymin = conf.low,
                      ymax = conf.high,
          color = adj.p.value < 0.05)) +
  geom_hline(yintercept = 0, 
             linetype = "dashed") +
  coord_flip() +
  labs(x = NULL,
       colour = "padj < .05")

post-hoc tests

facet plot

snake plot and facetting

  • from the previous snakeplot
  • facet by term

post-hoc tests

plotting

adding facet_wrap(~ term)

ANCOVA

short introduction

ANCOVA

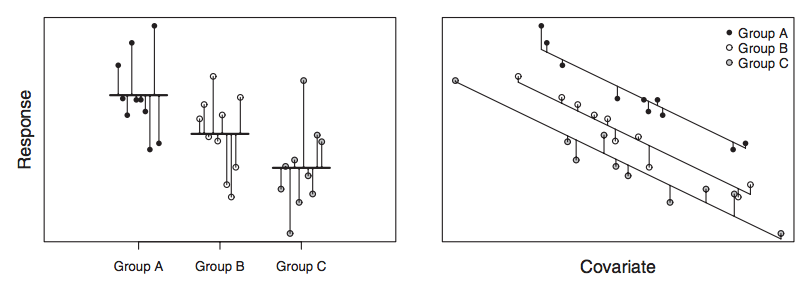
continuous and categorical predictors

We estimate a slope and a intercept for each level of one or more factor Michael Crawley

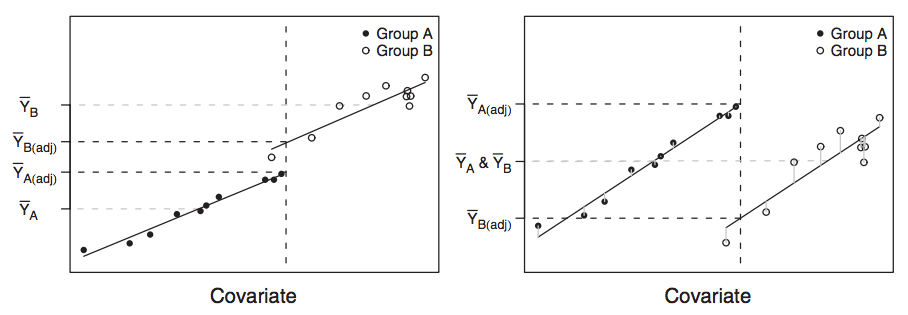
A continous variable added to an ANOVA is a covariate

source: M. Logan, Chapter 15

On the right panel, could predict an interaction?

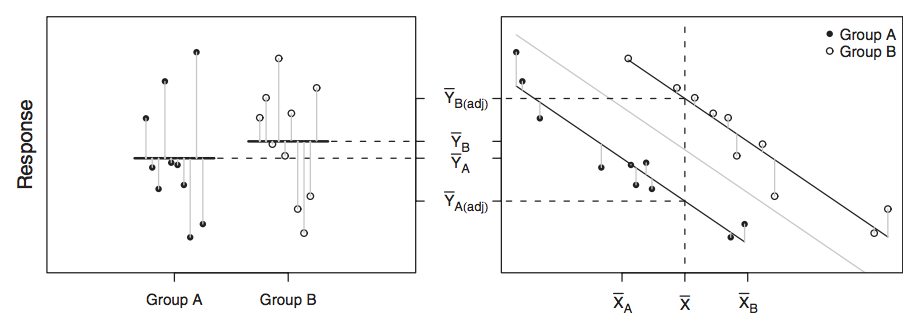
ANCOVA to increase explained variance

Adjust mean estimate of levels using the covariate’s mean

source: M. Logan, Chapter 15

ANCOVA, covariate must be in the range

source: M. Logan, Chapter 15

Before we stop

Acknowledgments

Some of the figures in this presentation are taken from:

  • Biostatistic Design and Analysis Using R. (Wiley-Blackwell, 2011) Murray Logan

People

  • Hákon Jónsson
  • Luc Buissière