October 2019
ggplot2
Learning objectives
You will learn to:

- Understand the basic grammar of graphics
- How it is implemented in
ggplot2- input data,
data.frame/tibble - aesthetics
- geoms
- facets
- themes
- input data,
- Make quick exploratory plots of your multidimensional data.
- Know how to find help on
ggplot2when you run into problems.
Introduction
ggplot2
- stands for grammar of graphics plot v2
- Inspired by Leland Wilkinsons work on the grammar of graphics in 2005.
Idea: split a graph into layers
- such as axis, curve(s), labels.
- 3 main elements are required: data, aesthetics, geometry \(\geqslant 1\)
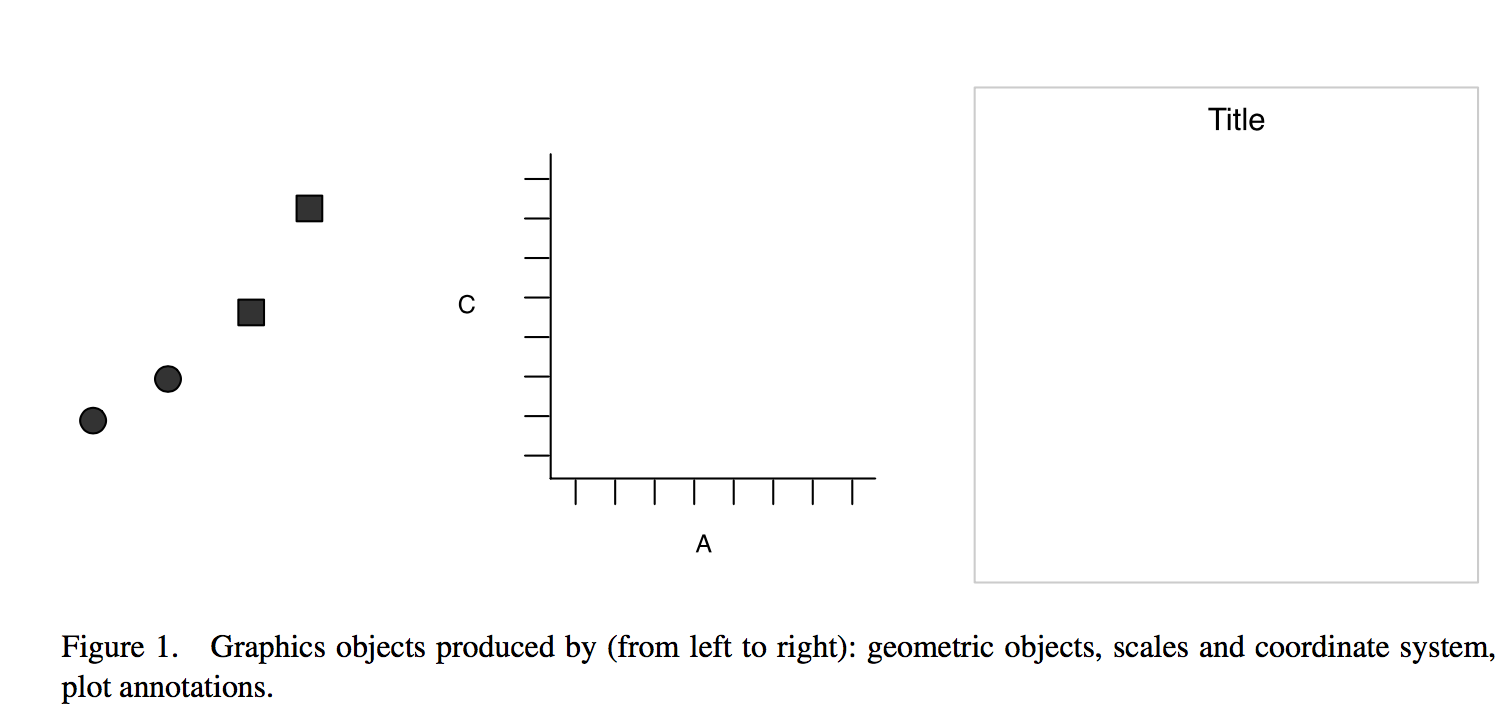
source: thinkR
Simple example
Wickham 2007
dataset
| x | y | shape |
|---|---|---|
| 25 | 11 | circle |
| 0 | 0 | circle |
| 75 | 53 | square |
| 200 | 300 | square |
aesthetics
x = x, y = y, shape = shape
geometric object
dot / point
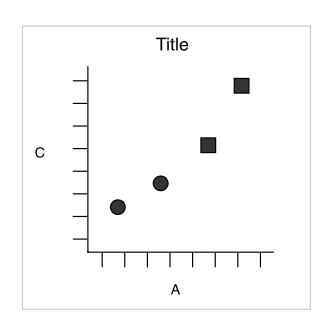
What if we want to split circles and squares?
Faceting
aka trellis or lattice plots
Split by the shape

Redundancy

Now, dot shapes and facets provide the same information.
We could use the shape for another meaningful variable…
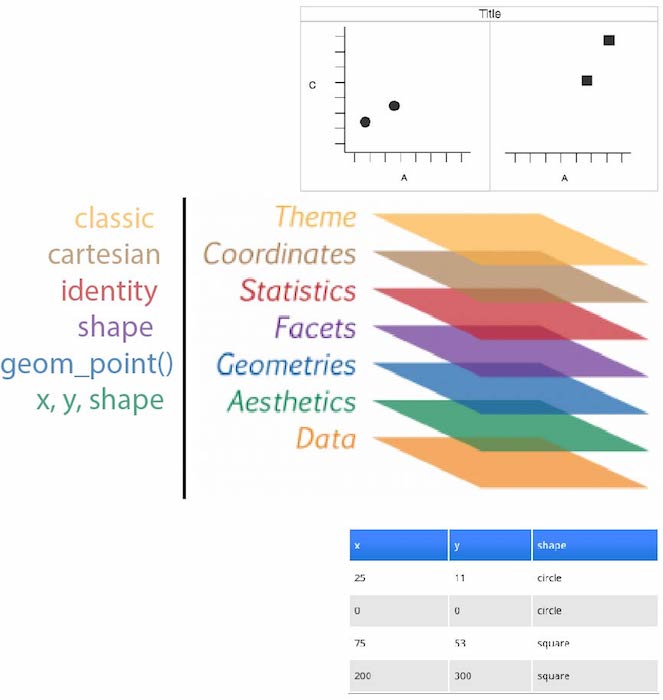
Layers

Data
| x | y | shape |
|---|---|---|
| 25 | 11 | circle |
| 0 | 0 | circle |
| 75 | 53 | square |
| 200 | 300 | square |
Motivation for this layered system
Data visualisation is not meant just to be seen but to be read, like written text Alberto Cairo
Geometric objects
geoms define the type of plot which will be drawn
geom_point()

geom_line()
geom_bar()
geom_boxplot()

geom_histogram()
geom_density()
Cheatsheet
Have a look at the cheatsheet or the ggplot2 online documentation to list more possibilities.
The dataset
Convert iris as a tibble
iris <- as_tibble(iris)
iris
# A tibble: 150 x 5
   Sepal.Length Sepal.Width Petal.Length Petal.Width Species
          <dbl>       <dbl>        <dbl>       <dbl> <fct>
 1          5.1         3.5          1.4         0.2 setosa
 2          4.9         3            1.4         0.2 setosa
 3          4.7         3.2          1.3         0.2 setosa
 4          4.6         3.1          1.5         0.2 setosa
 5          5           3.6          1.4         0.2 setosa
 6          5.4         3.9          1.7         0.4 setosa
 7          4.6         3.4          1.4         0.3 setosa
 8          5           3.4          1.5         0.2 setosa
 9          4.4         2.9          1.4         0.2 setosa
10          4.9         3.1          1.5         0.1 setosa
# … with 140 more rows
Tip
saving the data frame as a tibble enables the smart tibble printing and avoids to list all 150 rows
Your first plot
Draw your first plot
ggplot(data = iris) +
  geom_point(mapping = aes(x = Petal.Width, y = Petal.Length))
Layers and pipes
Warning

ggplot2 introduces a break in the workflow from %>% to +
ggplot1
ggplot1 was released in 2005 until 2008 by Hadley Wickham.
If the pipe ( %>% in 2014) had been invented before,
ggplot2would have never existed Hadley Wickham
ggplot1: original syntax
# devtools::install_github("hadley/ggplot1")
library(ggplot1)
p <- ggplot(mtcars, list(x = mpg, y = wt))
# need temp p object to avoid too many ()'s
scbrewer(ggpoint(p, list(colour = gear)))
ggplot1 with the pipe
library(ggplot1)
mtcars %>%
  ggplot(list(x = mpg, y = wt)) %>%
  ggpoint(list(colour = gear)) %>%
  scbrewer()
ggplot2
library(ggplot2)
mtcars %>%
  ggplot(aes(x = mpg, y = wt)) +
  geom_point(aes(colour = as.factor(gear))) +
scale_colour_brewer("gear", type = "qual")Mapping aesthetics
definitions
- aesthetics map the columns of a
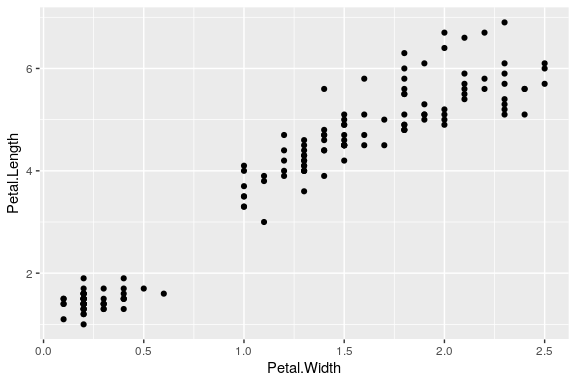
tibbleto the variable each ggplot2geomis expecting. geom_point()for example requires at least the x and y coordinates to draw each point.
In our example we need to tell geom_point() which columns should be used as x and y
ggplot(iris) +
  geom_point(aes(x = Petal.Width, y = Petal.Length))
aesthetics requirements

- each
geomhas specific requirement depending on its input- univariate, one x like histogram or density
- bivariate, x and y like scatterplot
- and requirements for continuous or discrete variable
geom_boxplot()expects 1 discrete and 1 continuous
Unmapped parameters
geom_point()accepts additional arguments such as thecolour, the transparency (alpha) or thesize- possible to define them to a fixed value without mapping them to a variable.
ggplot(iris) +
  geom_point(aes(x = Petal.Width, y = Petal.Length), # end of aes()
             colour = "blue", alpha = 0.6, size = 3)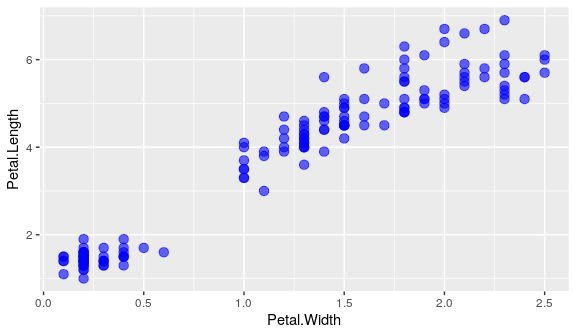
important
Note that parameters defined outside the aesthetics aes() are applied to all data.
Mapping aesthetics
colour
colour,alphaorsizecan also be mapped to a column in the data frame.- We can for example attribute a different colour to each species.
ggplot(iris) +
  geom_point(aes(x = Petal.Width, y = Petal.Length,
                 colour = Species), alpha = 0.6, size = 3)
important
Note that the colour argument is now inside aes() and must refer to a column in the dataframe.
Mapping aesthetics
shape
Mapping shape and colour to Species
ggplot(iris) +
  geom_point(aes(x = Petal.Width, y = Petal.Length, shape = Species, colour = Species),
             alpha = 0.6, size = 3)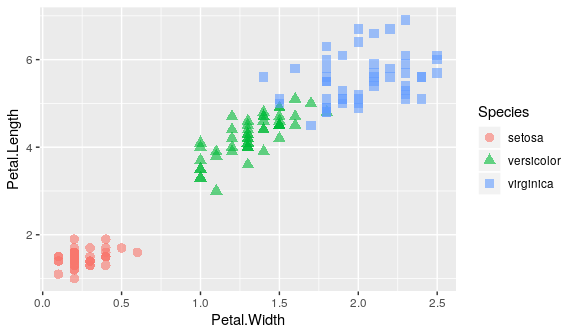
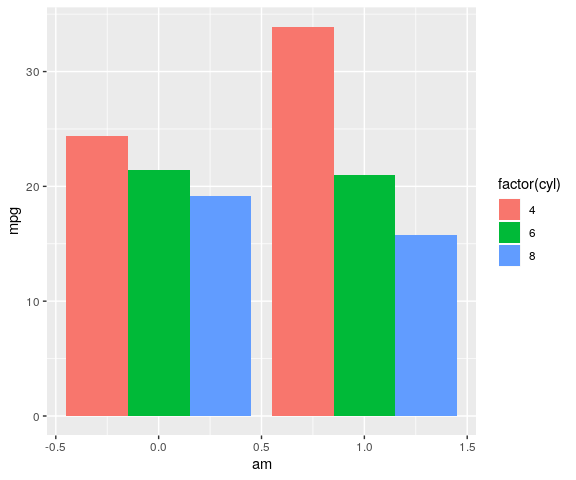
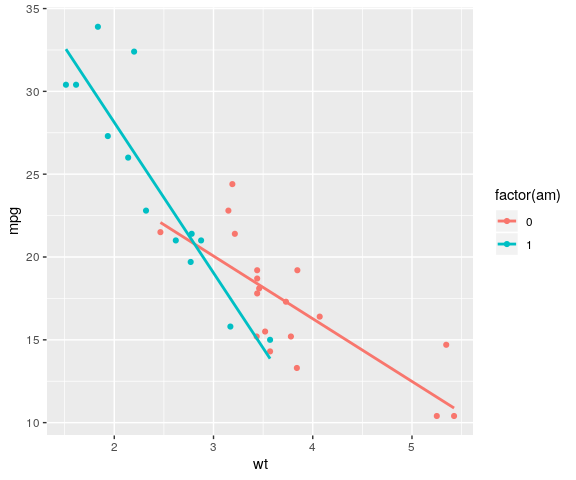
ggplot() is passing aesthetics to all geoms
colour in geom inherited
mtcars %>%
ggplot(aes(x = wt, y = mpg,
colour = factor(am))) +
geom_point() +
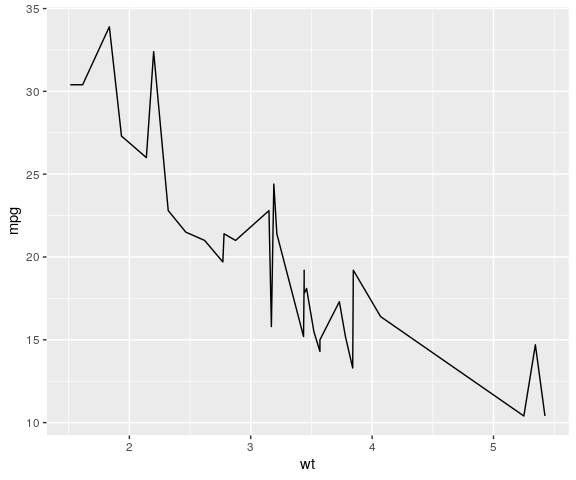
geom_smooth(method = "lm", se = FALSE)
colour only for geom_point()
mtcars %>%
  ggplot(aes(x = wt, y = mpg)) +
  geom_point(aes(colour = factor(am))) +
  geom_smooth(method = "lm", se = FALSE)

Labels
It is easy to adjust axis labels and the title using the labs() function
ggplot(iris) +
  geom_point(aes(x = Petal.Width, y = Petal.Length, colour = Species),
             alpha = 0.6, size = 3) +
  labs(x = "Width", y = "Length",
       colour = "flower",
       title = "Iris dataset", subtitle = "petal measures",
       tag = "A", caption = "Fisher, R. A. (1936)")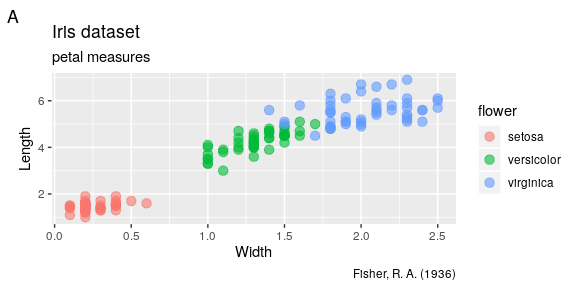
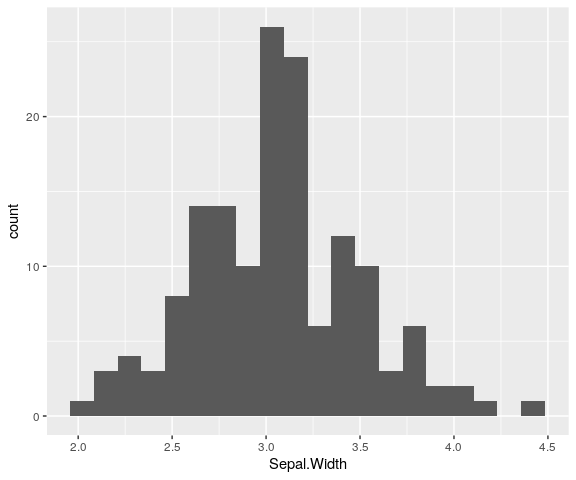
Histograms
ggplot(iris) +
  geom_histogram(aes(x = Petal.Length, fill = Species),
                 alpha = 0.8, bins = 30)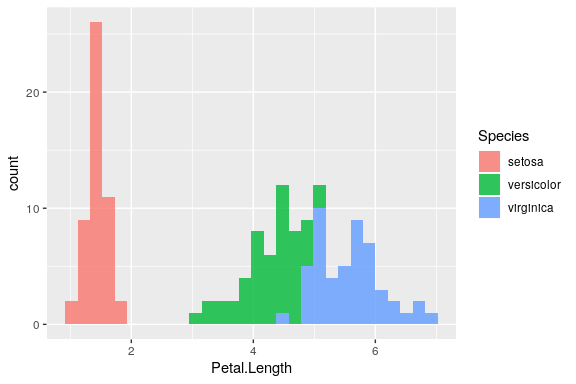
Tip
The default bin value is 30 and will be printed out as a warning.
Specify your own to avoid the warning.
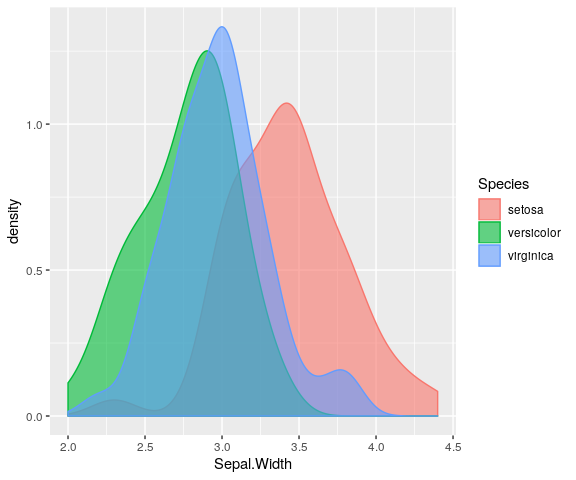
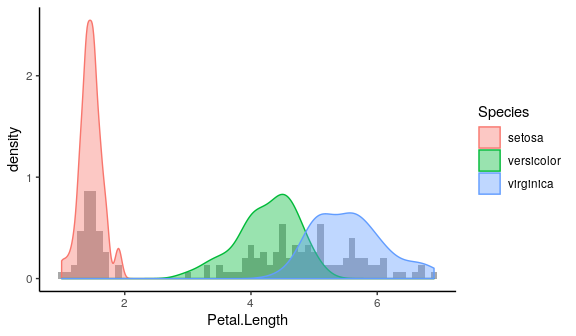
Density plot
The density is the count divided by the total number of occurences.
ggplot(iris) +
  geom_density(aes(x = Petal.Length, fill = Species),
               alpha = 0.6)
Overlaying plots
Density plot and histogram
ggplot(iris) +
  geom_histogram(aes(x = Petal.Length, y = stat(density)), fill = "darkgrey", binwidth = 0.1) +
  geom_density(aes(x = Petal.Length, fill = Species, colour = Species), alpha = 0.4) +
  theme_classic()
Stat functions
transform data
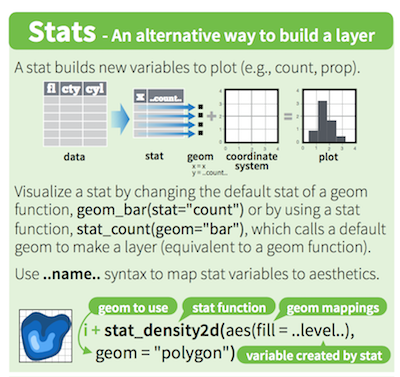
- variables call with
stat(var)are intermediate values calculated byggplot2using stat functions geomuses astatfunction to transform the data:geom_histogram()usesstat_bin()- for frequency:
(y = stat(count / max(count))) - stat variable used in density plots:
stat(density). stat_identityis used ingeom_col()(no transformation)
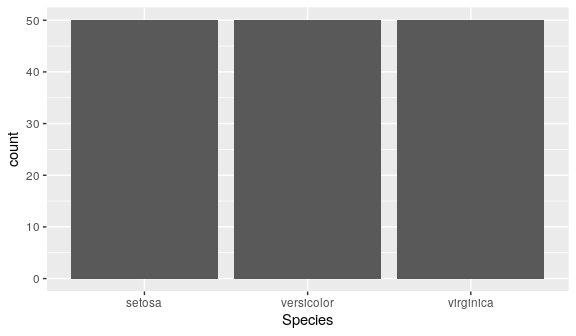
Barcharts
categorical variables
geom_bar()
geom_bar()counts the number of values in each categorygeom_bar()usesstat_count()(createscountcolumn)
ggplot(iris) +
  geom_bar(aes(x = Species))
# or: geom_bar(aes(x = Species, y = stat(count)))
Barcharts
categorical variables
geom_col()
geom_col()usesstat_identity()leaving the data as is.- The
yaesthetic is mandatory forgeom_col() - Using
geom_bar()withstat = "identity"will letgeom_bar()to behave likegeom_col()
ggplot(iris) +
  geom_col(aes(x = Species,
               y = Petal.Length))
#ggplot(iris) +
#  geom_bar(aes(x = Species, y = Petal.Length),
#           stat = "identity")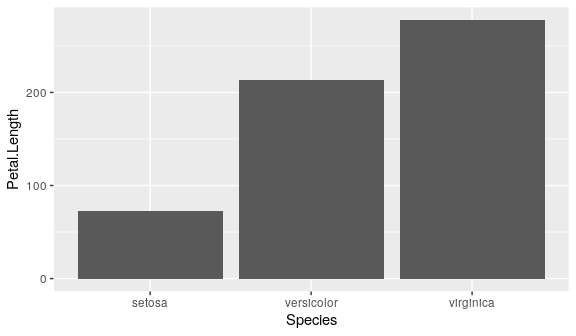
Stacked barchart
categorical variables
Let’s use the mtcars dataset now.
force factor to convert continuous -> discrete
mtcars %>%
  ggplot() +
  geom_bar(aes(x = factor(cyl),
               fill = factor(gear)))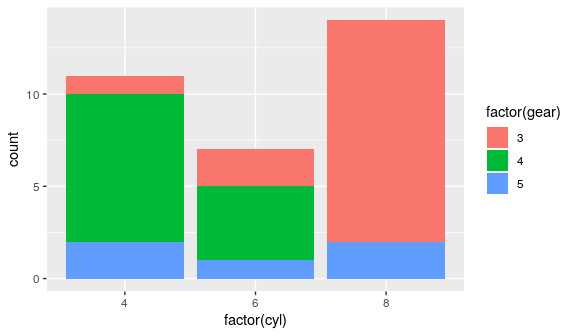
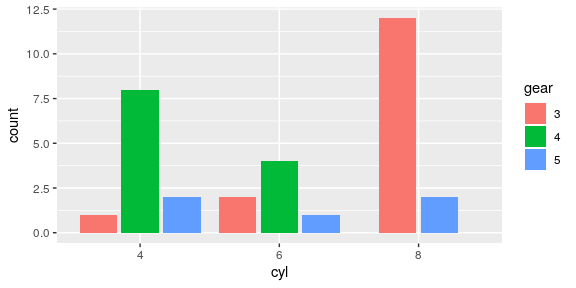
Dodged barchart (side by side)
categorical variables
Do not stack the barcharts but adjust the horizontal position.
mtcars %>%
  mutate(cyl = factor(cyl), gear = factor(gear)) %>%
  ggplot() +  # position_dodge2 from v3.0 preserves single or total
  geom_bar(aes(x = cyl, fill = gear), position = position_dodge2(preserve = "single"))
Stacked barchart for proportions
categorical variables
Let’s stack the barcharts but show proportions.
mtcars %>%
  mutate(cyl = factor(cyl), gear = factor(gear)) %>%
  ggplot() +
  geom_bar(aes(x = cyl, fill = gear), position = "fill")

Stacked barchart for proportions
pie charts
We can easily switch to polar coordinates:
mtcars %>%
  mutate(cyl = factor(cyl), gear = factor(gear)) %>%
  ggplot() +
  geom_bar(aes(x = cyl, fill = gear), position = "fill") +
  coord_polar()

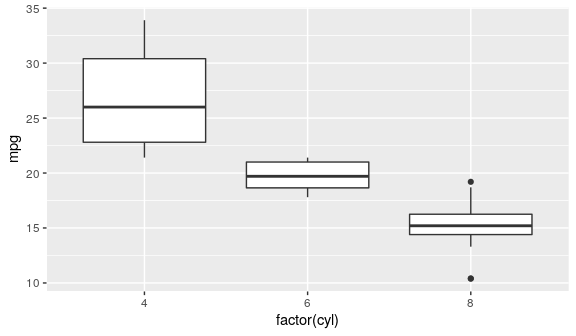
Boxplot
IQR, median
ggplot(mtcars) +
  geom_boxplot(aes(x = factor(cyl), y = mpg))
Boxplot
dodges by default
ggplot(mtcars) +
  geom_boxplot(aes(x = factor(cyl),
                   y = mpg,
                   fill = factor(am)))
Customising the colours
manual definition
- using
scale_fill_manual()andscale_color_manual() - not handy as you must provide as much colours as they are groups
ggplot(mtcars) +
  geom_boxplot(aes(x = factor(cyl), y = mpg, fill = factor(am), color = factor(am))) +
  scale_fill_manual(values = c("red", "lightblue")) +
  scale_color_manual(values = c("purple", "blue"))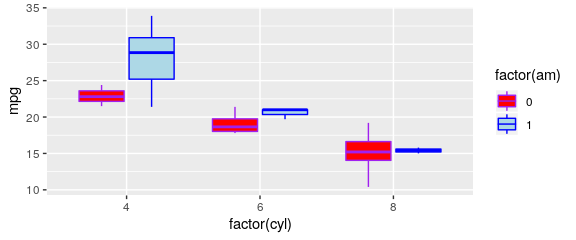
Predefined colour palettes
library(RColorBrewer)
par(mar = c(0, 4, 0, 0))
display.brewer.all()

Custom colours
using brewer
ggplot(mtcars) +
  geom_boxplot(aes(x = factor(cyl), y = mpg,
                   fill = factor(am), colour = factor(am))) +
  scale_fill_brewer(palette = "Pastel2") +
  scale_colour_brewer(palette = "Set1")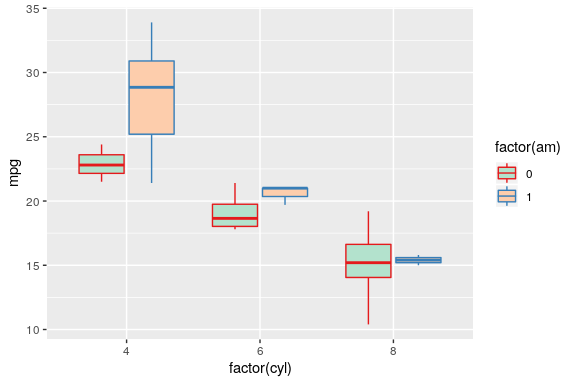
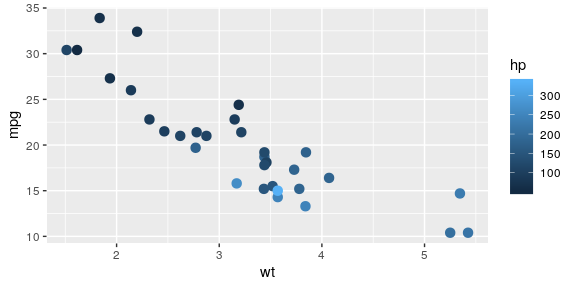
Colour gradient
The default gradient generated by ggplot2 is not very good…
ggplot(mtcars, aes(x = wt, y = mpg, colour = hp)) +
  geom_point(size = 3)
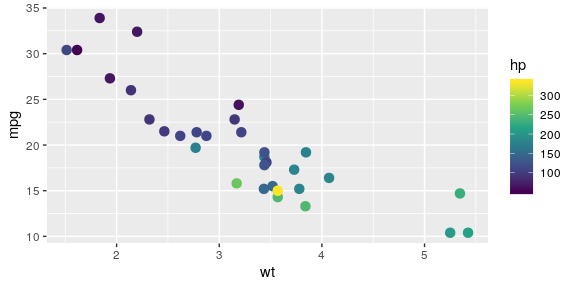
Colour gradient
- Use the
viridispalette instead.
ggplot(mtcars, aes(x = wt, y = mpg, colour = hp)) +
  geom_point(size = 3) +
  scale_colour_viridis_c()
Colour gradient
(and discrete variables)
viridis

- 5 different scales
- viridis is colour blind friendly and nice in b&w
- in
ggplot2since v3.0
cylinders example
ggplot(mtcars,
       aes(x = wt, y = mpg,
           colour = factor(cyl))) +
  geom_point(size = 3) +
  scale_colour_viridis_d()

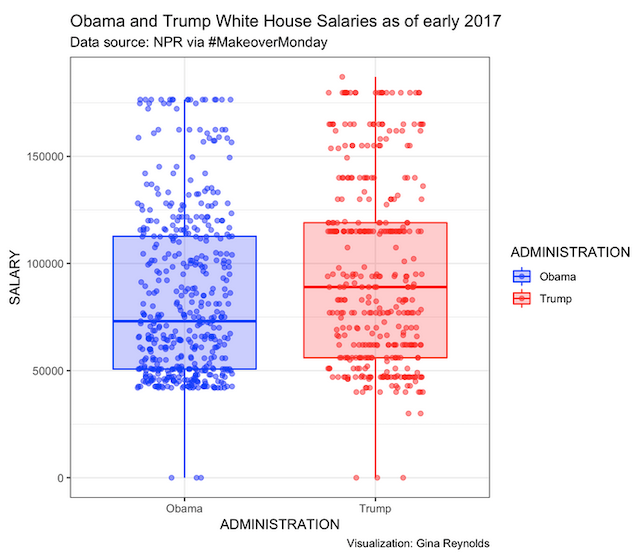
building a ggplot step by step
by Gina Reynolds
Trump / Obama employee salaries {.box-8 offset-2 .icon .intro .outline}
Facets
facet_wrap()
- To create facets, the easiest way is to use
facet_wrap() - Requires a one sided formula (in R formulas are composed using
~:lhs ~ rhs) - or the
vars()function
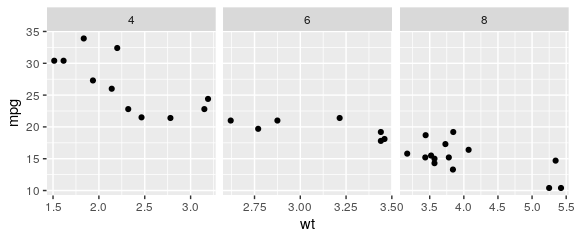
ggplot(mtcars) +
  geom_point(aes(x = wt, y = mpg)) +
  facet_wrap(~ cyl)

Facets
facet_wrap()
You can specify the number of columns
ggplot(mtcars) +
  geom_point(aes(x = wt, y = mpg)) +
  facet_wrap(~ cyl, ncol = 2)

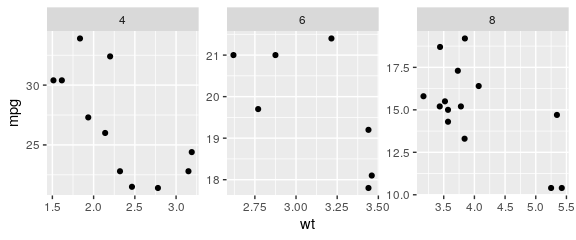
Facets
free scales
ggplot(mtcars) +
  geom_point(aes(x = wt, y = mpg)) +
  facet_wrap(~ cyl, scales = "free_x")
ggplot(mtcars) +
  geom_point(aes(x = wt, y = mpg)) +
  facet_wrap(~ cyl, scales = "free")
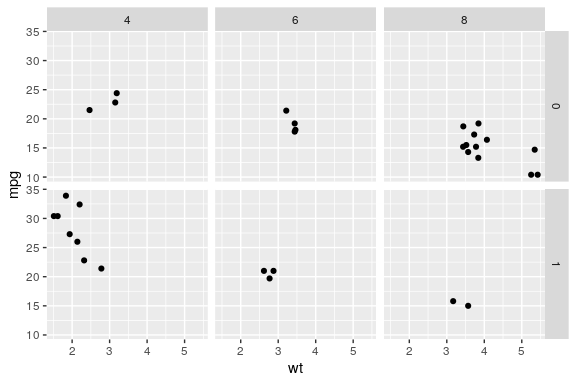
Facets
facet_grid() to lay out panels in a grid
Specify a formula
the rows on the left and columns on the right separated by a tilde ~ (i.e by)
ggplot(mtcars) +
  geom_point(aes(x = wt, y = mpg)) +
  facet_grid(am ~ cyl)
Facets
facet_grid() cont.
Specify one row/column
- A dot (
.) means no faceting for this axis. Mimicfacet_wrap() - the
labellerargument allows many customisations of strip titles
ggplot(mtcars) +
  # apply to all geoms!
  aes(x = wt, y = mpg) +
  geom_point() +
  facet_grid(. ~ cyl,
             labeller = label_both) +
  theme(strip.text = element_text(face = "bold"))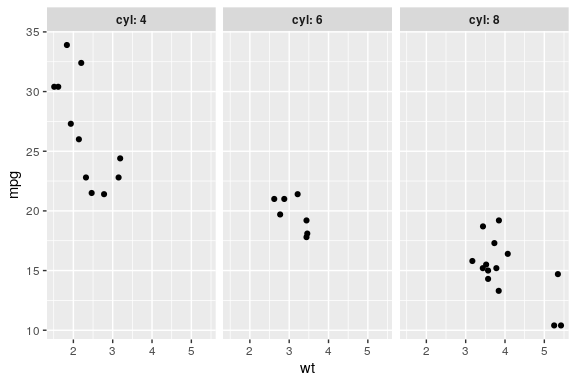
Exporting
interactive or passive mode
right panel
- Using the Export button in the Plots panel

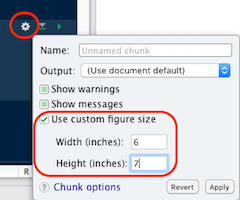
Rmarkdown reports
- If needed, adjust the chunk options:
- size:
fig.height,fig.width - ratio:
fig.asp… - others
- size:
ggsave
- save the
ggplotobject, 2nd argument - guesses the type of graphics by the extension
ggsave("my_name.png", p, width = 60, height = 30, units = "mm")
ggsave("my_name.pdf", p, width = 50, height = 50, units = "mm")Extensions
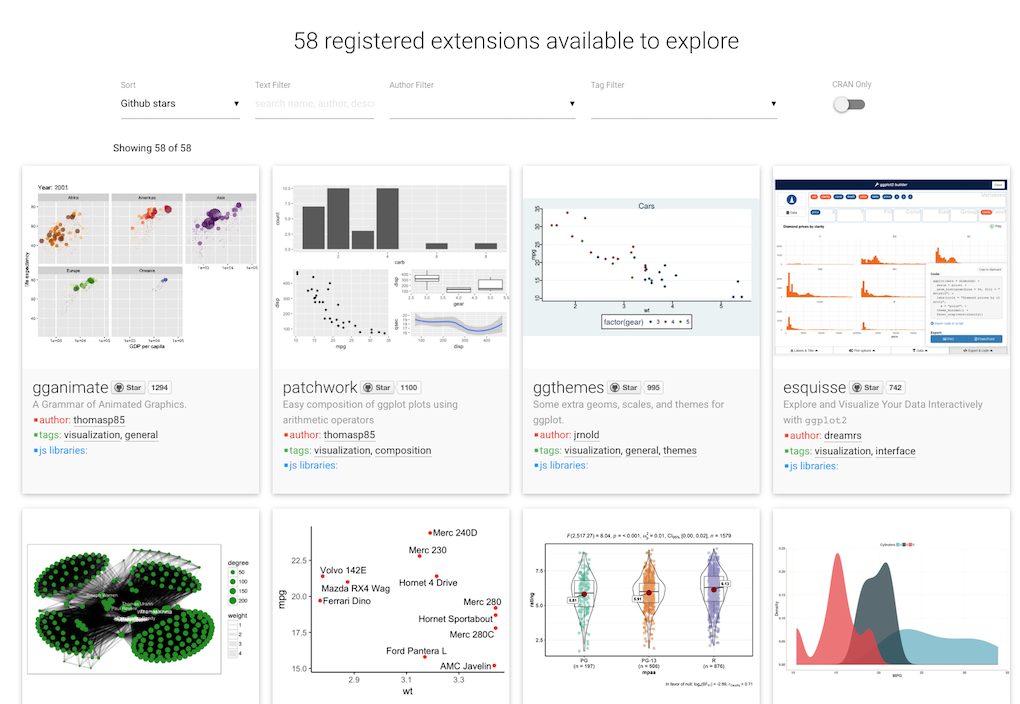
ggplot2 introduced the possibility for the community to contribute and create extensions.
They are referenced on a dedicated site
plot your data!
Anscombe ** 10
never trust summary statistics alone; always visualize your data Alberto Cairo

source: Justin Matejka, George Fitzmaurice Same Stats, Different Graphs…
Missing features
geoms list here
geom_tile()heatmapgeom_bind2d()2D binninggeom_abline()slope
stats list here
stat_ellipse()stat_summary()easy mean 95CI etc.geom_smooth()linear/splines/non linear
plot on multi-pages
ggforce::facet_grid_paginate()facetsgridExtra::marrangeGrob()plots
positions list here
position_jitter()random shiftquasirandom()is better
coordinate / transform
coord_cartesian()for zooming incoord_flip()exchanges x & yscale_x_log10()and yscale_x_sqrt()and y
customise theme elements
- legend & guide tweaks
- major/minor grids
- font, faces
- margins
- labels & ticks
- strip positions
- see live examples of pre-built themes
Programming
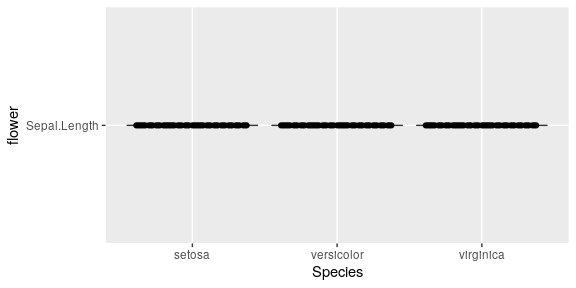
Sepal.Length is not exposed
iris_plot <- function(flower) {
  ggplot(iris, aes(x = Species, y = flower)) +
  geom_violin() +
  ggbeeswarm::geom_quasirandom()
}
iris_plot(flower = Sepal.Length)
Error in FUN(X[[i]], ...): object 'Sepal.Length' not found

strings does not help
iris_plot <- function(flower) {
  ggplot(iris, aes(x = Species, y = flower)) +
  geom_violin() +
  ggbeeswarm::geom_quasirandom(groupOnX = TRUE)
}
iris_plot(flower = "Sepal.Length")
Solution: tidyeval
quosures evaluated by curly-curly
iris_plot <- function(flower) {

  ggplot(iris, aes(x = Species, y = {{flower}})) +
  geom_violin() +
  ggbeeswarm::geom_quasirandom(groupOnX = TRUE)
}
iris_plot(flower = Sepal.Length)
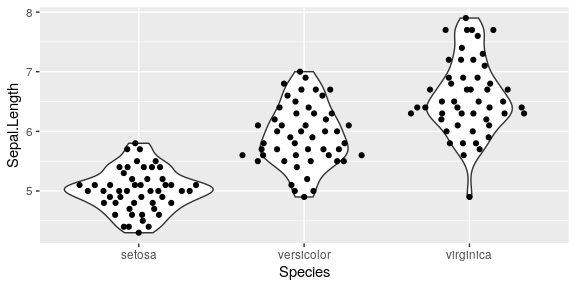
evaluate in context, {{}} is a shortcut for
enquo()create a quosure, name with its env of origin!!is bang bang that evaluate name in the appropriate context
build your plot step by step
using esquisse
- RStudio add-in
- by dreamRs
example
Before we stop
Acknowledgments

- Thinkr (Colin Fay)
- DreamRs (Victor Perrier, Fanny Meyer)
- Hadley Wickham
Art
by Marcus Volz
A compilation of some of my gifs created with #rstats #ggplot2 #gganimate #tweenr https://t.co/nCppSOZv4W
— Marcus Volz (@mgvolz) 4 avril 2017