Pipeline

September 2019
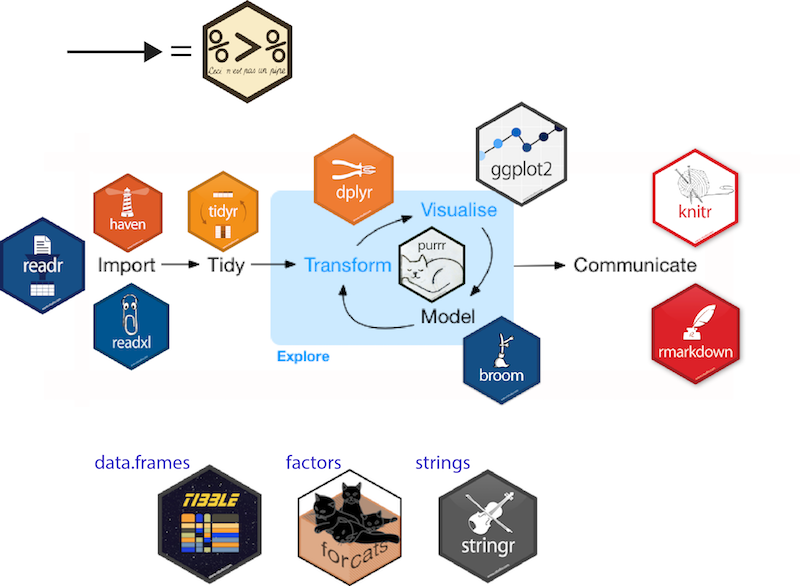
ggplot2, for data visualizationdplyr, for data manipulationtidyr, for data tidyingreadr, for data importpurrr, for functional programmingtibble, for tibbles, a modern re-imagining of data framessource: http://tidyverse.tidyverse.org/. H.Wickham
hms, for timesstringr, for stringslubridate, for date/timesforcats, for factorsfeather, for sharing datahaven, for SPSS, SAS and Stata fileshttr, for web apisjsonlite for JSONreadxl, for .xls and .xlsx filesrvest, for web scrapingxml2, for XML filesmodelr, for modelling within a pipelinebroom, for models -> tidy data@ucfagls yeah. I think the tidyverse is a dialect. But its accent isn’t so thick
— Hadley Wickham (@hadleywickham) 12 janvier 2017
data.table is faster, for less than 10 m rows, negligible.
Realized today: #tidyverse R and base #rstats have little in common. Beware when looking for job which requires knowledge of R.
— Yeedle N. (@Yeedle) 2 mars 2017
tibbles are nice but a lot of non-tidyverse packages require matrices. rownames still an issue.Anyway, learning the tidyverse does not prevent to learn R base, it helps to get things done early in the process
source: rdocumentation (2017/04/18)
source: rdocumentation (2017/04/18)

set.seed(12)
round(mean(rnorm(5)), 2)
[1] -0.76
set.seed(12)
rnorm(5) %>%
  mean() %>%
  round(2)
[1] -0.76
Of note, magrittr needs to loaded with either:
library(magrittr)
library(dplyr)
library(tidyverse)


Jenny Bryan in Jeff Leek blog post
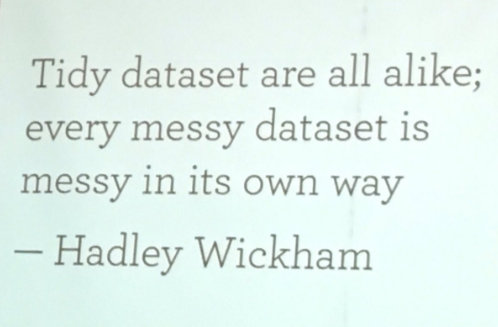
All happy families are alike; each unhappy family is unhappy in its own way. Leo Tolstoy, Anna Karenina
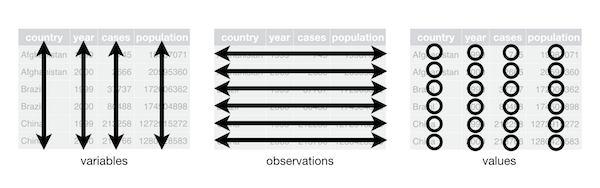
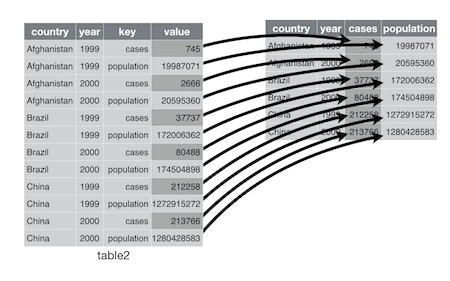
source: Garret Grolemund and vignette("tidy-data")
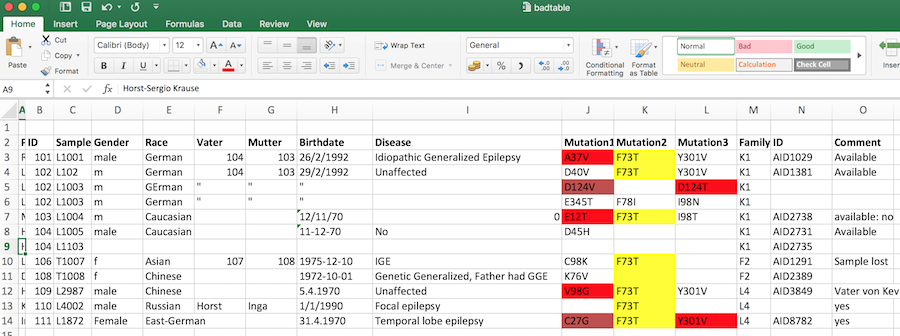
| Error | Tidy violation | Comment |
|---|---|---|
| Patient names | No | Data protection violation |
| Identical column names | Yes | Variable error |
| Inconsistent variables names | No | Bad practice |
| Non-English columns names | No | Bad practice |
| Color coding | No | The horror, the horror |
| Inconsistent dates | No | Use ISO8601 |
| Multiple columns for one item | Yes | One observation per line |
| Redundant information | Yes | Each variable is in its own column |
| Repeated rows | Yes | Each observation is in its own row |
| Uncoded syndromes | Yes/No | Each value in its own cell |
| Unnecessary information | No | like birthdate, comments: bad practice |
| Name of the table | No | You’ll see this often |
10 min, discuss
gather)separate)gather-spread)nest or table)dplyr data transformation)dplyr, combine into single table)
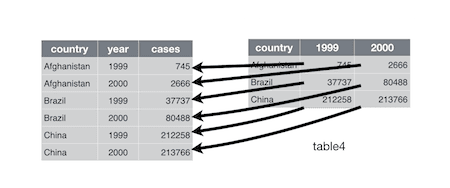
The wide format is generally untidy but found in the majority of datasets
count(mtcars, am, cyl)
# A tibble: 6 x 3
     am   cyl     n
  <dbl> <dbl> <int>
1     0     4     3
2     0     6     4
3     0     8    12
4     1     4     8
5     1     6     3
6 1 8 2count(mtcars, am, cyl) %>%
pivot_wider(names_from = cyl,
values_from = n) -> wcars
wcars
# A tibble: 2 x 4
     am   `4`   `6`   `8`
  <dbl> <int> <int> <int>
1     0     3     4    12
2 1 8 3 2wcars %>%
pivot_longer(cols = -am,
names_to = "cyl",
values_to = "n",
# optional prototype to get integers (not chr)
names_ptypes = list(cyl = integer()))# A tibble: 6 x 3
am cyl n
<dbl> <int> <int>
1 0 4 3
2 0 6 4
3 0 8 12
4 1 4 8
5 1 6 3
6 1 8 2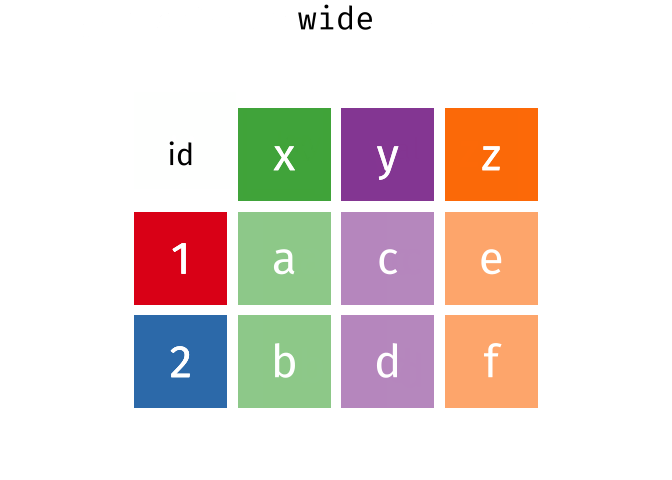
image from Garrick Aden-Buie, github repo
head(fish_encounters, 3)
# A tibble: 3 x 3
  fish  station  seen
  <fct> <fct>   <int>
1 4842  Release     1
2 4842  I80_1       1
3 4842  Lisbon      1
dim(fish_encounters)
[1] 114 3
library(tidyverse)
fish_wide <- fish_encounters %>%
  pivot_wider(
    names_from = station,
    values_from = seen
  )
fish_wide
# A tibble: 19 x 12
   fish  Release I80_1 Lisbon  Rstr Base_TD   BCE   BCW  BCE2  BCW2   MAE
   <fct>   <int> <int>  <int> <int>   <int> <int> <int> <int> <int> <int>
 1 4842        1     1      1     1       1     1     1     1     1     1
 2 4843        1     1      1     1       1     1     1     1     1     1
 3 4844        1     1      1     1       1     1     1     1     1     1
 4 4845        1     1      1     1       1    NA    NA    NA    NA    NA
 5 4847        1     1      1    NA      NA    NA    NA    NA    NA    NA
 6 4848        1     1      1     1      NA    NA    NA    NA    NA    NA
 7 4849        1     1     NA    NA      NA    NA    NA    NA    NA    NA
 8 4850        1     1     NA     1       1     1     1    NA    NA    NA
 9 4851        1     1     NA    NA      NA    NA    NA    NA    NA    NA
10 4854        1     1     NA    NA      NA    NA    NA    NA    NA    NA
11 4855        1     1      1     1       1    NA    NA    NA    NA    NA
12 4857        1     1      1     1       1     1     1     1     1    NA
13 4858        1     1      1     1       1     1     1     1     1     1
14 4859        1     1      1     1       1    NA    NA    NA    NA    NA
15 4861        1     1      1     1       1     1     1     1     1     1
16 4862        1     1      1     1       1     1     1     1     1    NA
17 4863        1     1     NA    NA      NA    NA    NA    NA    NA    NA
18 4864        1     1     NA    NA      NA    NA    NA    NA    NA    NA
19 4865        1     1      1    NA      NA    NA    NA    NA    NA    NA
# … with 1 more variable: MAW <int>
fish_wide %>%
  pivot_longer(
    cols = -fish,
    names_to = "station",
    values_to = "seen"
  )
# A tibble: 209 x 3
   fish  station  seen
   <fct> <chr>   <int>
 1 4842  Release     1
 2 4842  I80_1       1
 3 4842  Lisbon      1
 4 4842  Rstr        1
 5 4842  Base_TD     1
 6 4842  BCE         1
 7 4842  BCW         1
 8 4842  BCE2        1
 9 4842  BCW2        1
10 4842  MAE         1
# … with 199 more rows

Note that we get more rows than in the original dataset, as missing combination are now NA
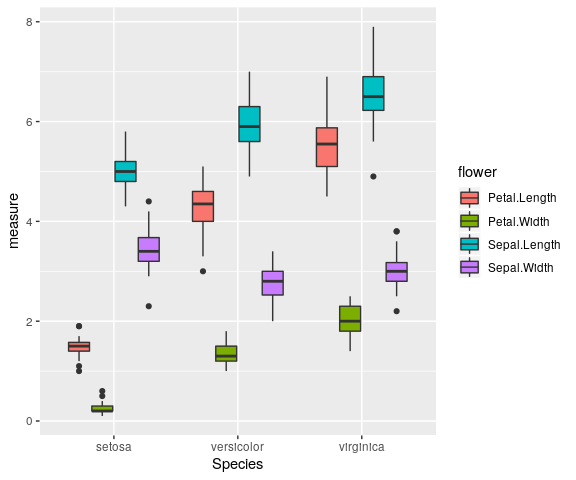
iris %>%
  pivot_longer(cols = -Species,
               names_to = "flower",
               values_to = "measure") %>%
  ggplot() +
  geom_boxplot(aes(x = Species, y = measure, fill = flower))
demo_tibble <- tibble(year  = c(2015, 2014, 2014),
                      month = c(11L, 2L, 4L),    # create a vector of integers
                      day   = c(23, 1, 30),      # default is double
                      value = c("high", "low", "low"))
demo_tibble
# A tibble: 3 x 4
   year month   day value
  <dbl> <int> <dbl> <chr>
1  2015    11    23 high
2  2014     2     1 low
3  2014     4    30 low
demo_tibble %>%
  unite(date, c(year, month, day),
        sep = "-") -> demo_tibble_unite
demo_tibble_unite
# A tibble: 3 x 2
  date       value
  <chr>      <chr>
1 2015-11-23 high
2 2014-2-1   low
3 2014-4-30  low
use quotes since we are not refering to objects
demo_tibble_unite %>%
  separate(date, c("year", "month", "day"))
# A tibble: 3 x 4
  year  month day   value
  <chr> <chr> <chr> <chr>
1 2015  11    23    high
2 2014  2     1     low
3 2014  4     30    low
patient_df <- tibble(
    subject_id = 1001:1003,
    visit_id = c("1,2,3", "1,2", "1"),
    measured = c("9,0, 11", "11, 3" , "12")  )
patient_df
# A tibble: 3 x 3
  subject_id visit_id measured
       <int> <chr>    <chr>
1       1001 1,2,3    9,0, 11
2       1002 1,2      11, 3
3       1003 1        12
Note the incoherent white space
separate_rows(patient_df,
              visit_id, measured,
              convert = TRUE) # chr -> int
# A tibble: 6 x 3
  subject_id visit_id measured
       <int>    <int>    <int>
1       1001        1        9
2       1001        2        0
3       1001        3       11
4       1002        1       11
5       1002        2        3
6 1003 1 12To split single variables use separate
separate() and unite() dummy <- data_frame(year = c(2015, 2014, 2014),
month = c(11, 2, 4),
day = c(23, 1, 30),
value = c("high", "low", "low"))Warning: `data_frame()` is deprecated, use `tibble()`. This warning is displayed once per session.
dummy
# A tibble: 3 x 4
   year month   day value
  <dbl> <dbl> <dbl> <chr>
1  2015    11    23 high
2  2014     2     1 low
3  2014     4    30 low
unite()dummy_unite <- unite(dummy, date,
year, month, day,
sep = "-")
dummy_unite# A tibble: 3 x 2 date value <chr> <chr> 1 2015-11-23 high 2 2014-2-1 low 3 2014-4-30 low
separate() and unite() separate()separate(dummy_unite,
date, c("year", "month", "day"))# A tibble: 3 x 4 year month day value <chr> <chr> <chr> <chr> 1 2015 11 23 high 2 2014 2 1 low 3 2014 4 30 low
kelpdf <- data.frame(
  Year = c(1999, 2000, 2004, 1999, 2004),
  Taxon = c("Saccharina", "Saccharina", "Saccharina", "Agarum", "Agarum"),
  Abundance = c(4, 5, 2, 1, 8)
)
kelpdf
Year Taxon Abundance 1 1999 Saccharina 4 2 2000 Saccharina 5 3 2004 Saccharina 2 4 1999 Agarum 1 5 2004 Agarum 8
how to fill it?
complete()complete(kelpdf,
Year, Taxon)
# A tibble: 6 x 3
   Year Taxon      Abundance
  <dbl> <fct>          <dbl>
1  1999 Agarum             1
2  1999 Saccharina         4
3  2000 Agarum            NA
4  2000 Saccharina         5
5  2004 Agarum             8
6  2004 Saccharina         2
example from imachorda.com
how to fill out this info with 0s?
complete(), option fillcomplete(kelpdf,
Year, Taxon,
fill = list(Abundance = 0))# A tibble: 6 x 3 Year Taxon Abundance <dbl> <fct> <dbl> 1 1999 Agarum 1 2 1999 Saccharina 4 3 2000 Agarum 0 4 2000 Saccharina 5 5 2004 Agarum 8 6 2004 Saccharina 2
example from imachorda.com
how to fill out this info with 0s?
complete(), option fill and helper full_seq()complete(kelpdf,
# helper tidyr::full_seq
Year = full_seq(Year, period = 1),
Taxon,
fill = list(Abundance = 0))# A tibble: 12 x 3
Year Taxon Abundance
<dbl> <fct> <dbl>
1 1999 Agarum 1
2 1999 Saccharina 4
3 2000 Agarum 0
4 2000 Saccharina 5
5 2001 Agarum 0
6 2001 Saccharina 0
7 2002 Agarum 0
8 2002 Saccharina 0
9 2003 Agarum 0
10 2003 Saccharina 0
11 2004 Agarum 8
12 2004 Saccharina 2example from imachorda.com
separate_rows(patient_df,
              visit_id, measured,
              convert = TRUE)
# A tibble: 6 x 3
subject_id visit_id measured
<int> <int> <int>
1 1001 1 9
2 1001 2 0
3 1001 3 11
4 1002 1 11
5 1002 2 3
6 1003 1 12complete(), with helper nesting()patient_complete <- separate_rows(patient_df,
visit_id, measured,
convert = TRUE) %>%
complete(subject_id, nesting(visit_id))
patient_complete# A tibble: 9 x 3
subject_id visit_id measured
<int> <int> <int>
1 1001 1 9
2 1001 2 0
3 1001 3 11
4 1002 1 11
5 1002 2 3
6 1002 3 NA
7 1003 1 12
8 1003 2 NA
9 1003 3 NAnest()patient_nested <- patient_complete %>% nest(visit_id, measured)
Warning: All elements of `...` must be named. Did you want `data = c(visit_id, measured)`?
patient_nested
# A tibble: 3 x 2
subject_id data
<int> <list<df[,2]>>
1 1001 [3 × 2]
2 1002 [3 × 2]
3 1003 [3 × 2]unnest()unnest(patient_nested)
Warning: `cols` is now required. Please use `cols = c(data)`
# A tibble: 9 x 3
  subject_id visit_id measured
       <int>    <int>    <int>
1       1001        1        9
2       1001        2        0
3       1001        3       11
4       1002        1       11
5       1002        2        3
6       1002        3       NA
7       1003        1       12
8       1003        2       NA
9 1003 3 NAgroup_by and nest()patient_complete %>% group_by(subject_id) %>% nest(.key = "visit")
Warning: `.key` is deprecated
# A tibble: 3 x 2
# Groups:   subject_id [3]
  subject_id          visit
       <int> <list<df[,2]>>
1       1001        [3 × 2]
2       1002        [3 × 2]
3 1003 [3 × 2]data by defaulttidyr
complete, separate_rows and nest()base to tidyverse, Rajesh Korde, blog’ post
Comments
dplyrtidyranddplyrare intertwinedtidyrways