September 2019

Overview

The goal is to learn statistics applied to biology using and its dialect

This course of ~ 60 hours is composed of:

lectures

  • slides, formal lecture
  • quick exercices inserted
  • unprepared live demo

practical sessions

  • detailed exercices
  • solutions available

project

  • team up by (2, 3)
  • due date: mid-Dec
  • defend 17th Dec

3 ECTS

  • written exam
  • 2 hours
  • no document allowed

3 ECTS

  • practical exam, Rmd file
  • 2 hours
  • all document allowed
  • internet allowed

1 ECTS

internet access allowed, watch out time

why allowed

downside

2 hours vanish fast if you aren’t prepared

Contents

lectures

  • Introduction to programming, basic concepts of algorithm building, R language using the tidyverse
  • Descriptive statistics with R, examples of large dataset analysis
  • Hypothesis testing, concepts of p-value and confidence intervals
  • Data fitting, estimations of goodness of fit
  • Non-parametric tests
  • Linear regression models, simple or + predictors
  • Generalized linear models
  • Count data
  • Unsupervised learning using principal component analysis

content from

  • Eric Koncina
  • Roland Krause
  • Charandeep Singh
  • Dylan Childs
  • Sean Sapcariu

Reading

books

Teachers

Lecture 1

Learning objectives

You will learn:

  • R specificity
    • community
    • package ecosystem
    • vectorization
  • opinionated tidyverse
  • Rstudio layout
  • basic data types
  • basic data structures

What is R?

R is shorthand for “GNU R”:

  • An interactive programming language derived from S (J. Chambers, Bell Lab, 1976)
  • Appeared in 1993, created by Ross Ihaka and Robert Gentleman, University of Auckland, NZ
  • Focus on data analysis and plotting
  • R is also shorthand for the ecosystem around this language
    • Book authors
    • Package developers
    • Ordinary useRs

Learning to use R will make you more efficient and facilitate the use of advanced data analysis tools

Why use R?

  • It’s free! and open-source
  • easy to install / maintain
  • multi-platform (Windows, macOS, GNU/Linux)
  • can process big files and analyse huge amounts of data (db tools)
  • integrated data visualization tools, even dynamic shiny
  • fast, and even faster with C++ integration via Rcpp.
  • easy to get help

Twitter R community

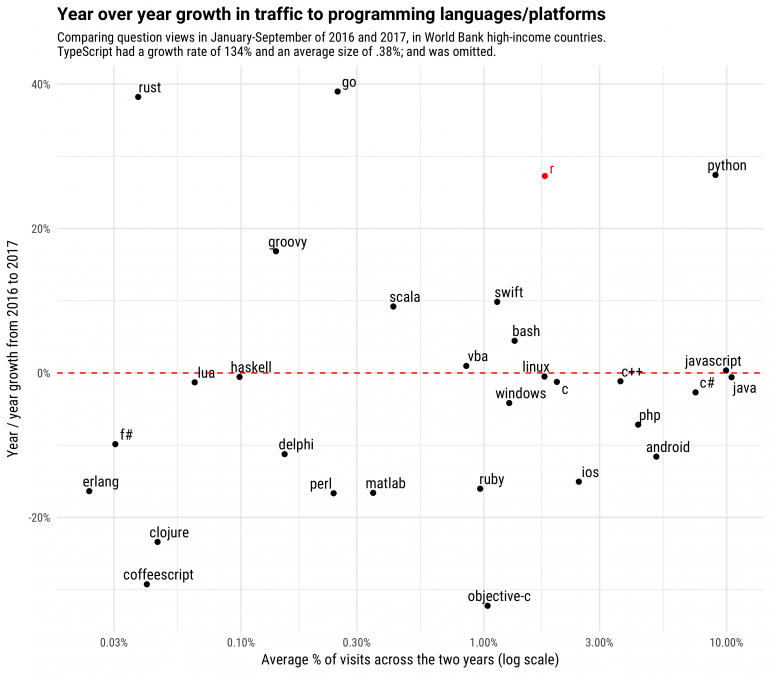
Constant trend

Packages

+15,000 in Sept 2019

CRAN

reliable: package is checked during submission process

MRAN for Windows users

bioconductor

dedicated to biology. status

typical install:

# install.packages("BiocManager")
BiocManager::install("limma")

GitHub

easy install thanks to devtools. status

# install.packages("remotes")
remotes::install_github("tidyverse/readr")

could be a security issue

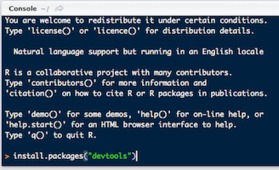
CRAN install from Rstudio

github install from Rstudio’ console

more in the article from David Smith

Help pages

2 possibilities for manual pages.

?log
help(log)

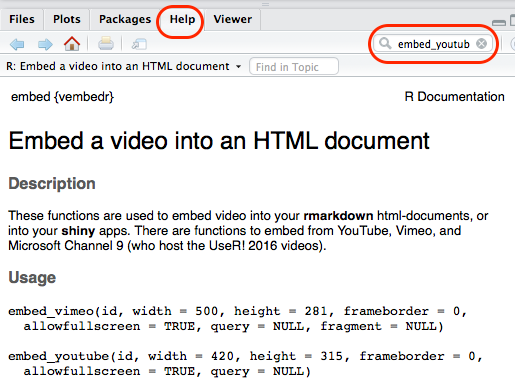
In Rstudio, the help page can be viewed in the bottom right pane

Sadly

manpages are often unhelpful, now vignettes (and articles on tidyverse) are better and described workflows.

Drawback: Steep learning curve

Period of much suckiness

R is hard to learn

R base is complex, has a long history and many contributors

Why R is hard to learn

  • Unhelpful help ?print
  • generic methods print.data.frame
  • too many commands colnames, names
  • inconsistent names read.csv, load, readRDS
  • unstrict syntax, was designed for interactive usage
  • too many ways to select variables df$x, df$"x", df[,"x"], df[[1]]
  • […] see r4stats’ post for the full list
  • the tidyverse curse

Navigating the balance between base R and the tidyverse is a challenge to learn Robert A. Muenchen

Tidyverse

creator

We think the tidyverse is better, especially for beginners. It is

  • recent (both an issue and an advantage)
  • allows doing powerful things quickly
  • unified
  • consistent, one way to do things
  • give strength to learn base R
  • criticisms will come later (yes, many)

Hadley Wickham

Hadley, Chief Scientist at Rstudio

  • coined the tidyverse at userR meeting in 2016
  • developed and maintains most of the core tidyverse packages

Tidyverse

core packages

Tidyverse

packages in processes

Tidyverse

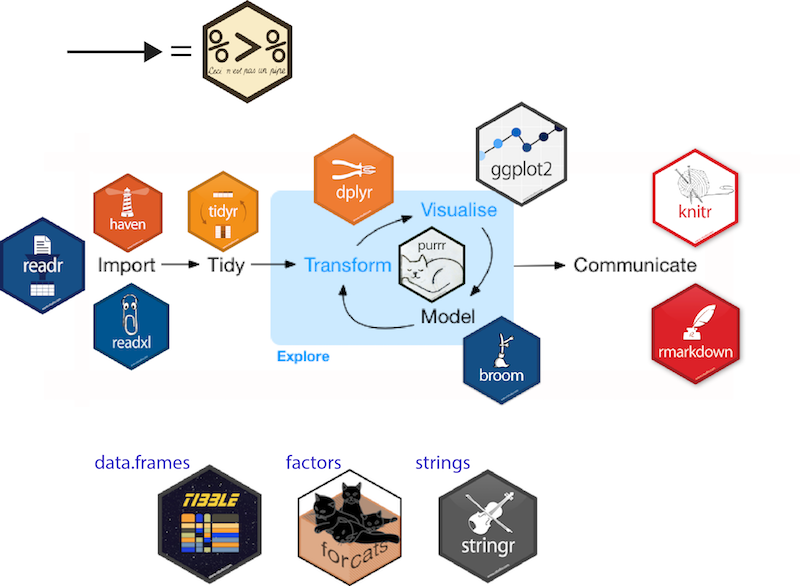
workflow

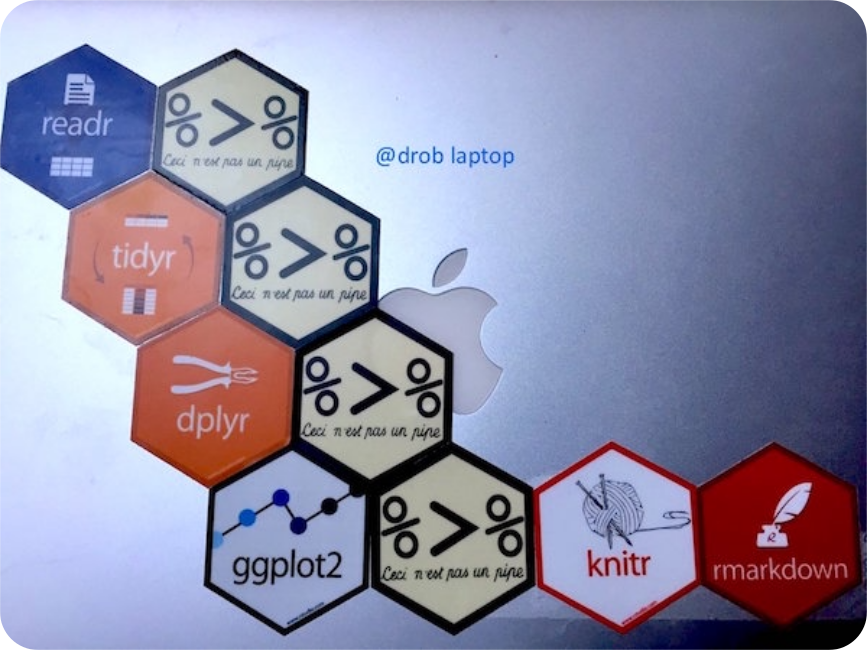
Pipeline

David Robinson

@drob on twitter

RStudio

Rstudio

What is it?

RStudio is an Integrated Development Environment.
It makes working with R much easier

Features

  • Projects to ease files organisation
  • Console to run R, with syntax highlighter
  • full support for Rmarkdown docs & chunks
  • Viewer for data / plots / website
  • Package management (including building, tests and developement)
  • Autocompletion using TAB
  • Cheatsheets
  • Git integration for versioning
  • Inline outputs
  • Keyboard shortcuts
  • Notebooks
  • integrated Terminal
  • Jobs for running long runs in a separated session

Warning

Don’t mix up R and RStudio.
R needs to be installed first.

Rstudio

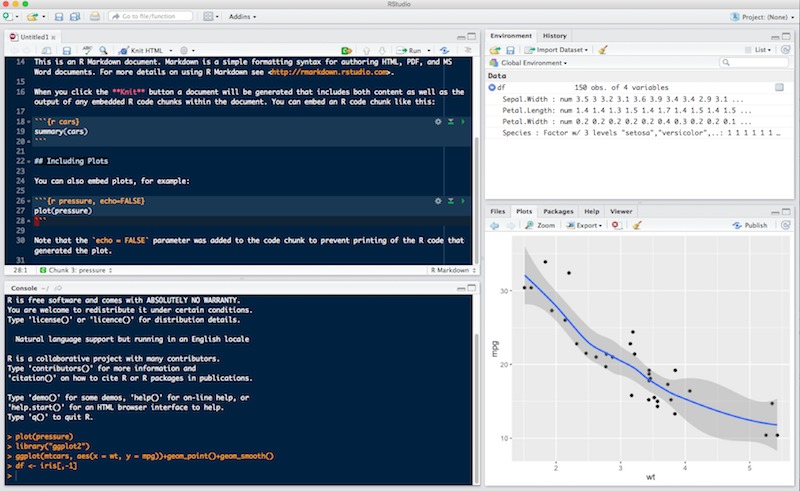
The 4 panels layout

Four panels

scripting

  • could be your main window
  • should be a Rmarkdown doc
  • tabs are great

Environment

  • Environment, display loaded objects and their str()
  • History is useless IMO
  • nice git integration
  • database connections interface

Console

  • could be hidden with inline outputs
  • rmarkdown output logs
  • optional, embed a nice terminal tab

Files / Plots / Help

  • necessary package management tab
  • unnecessary plots panel when using inline outputs
  • useful help tab

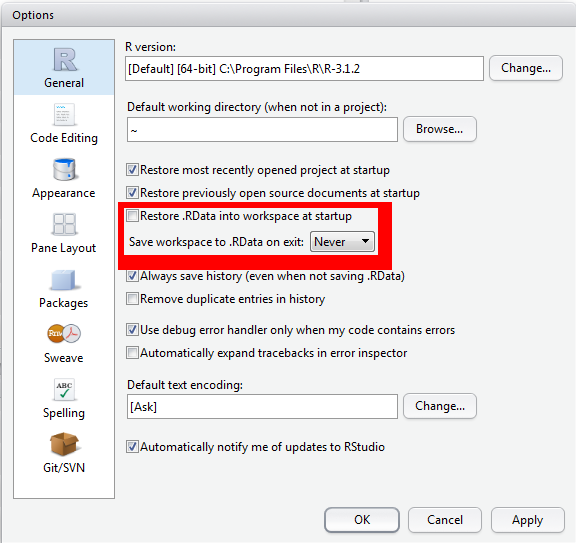
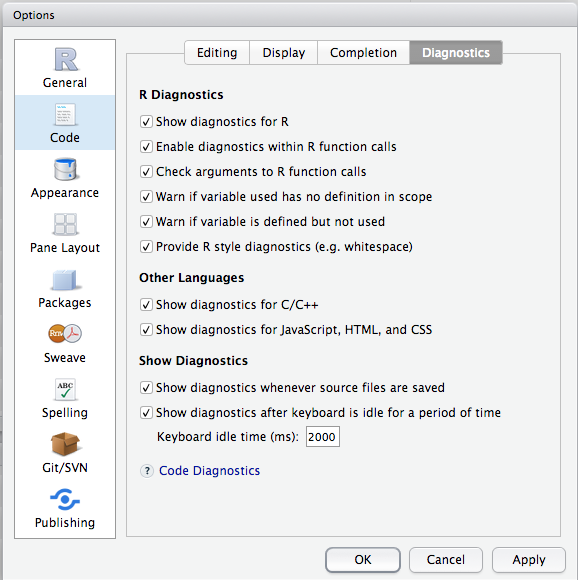
For reproducibility, options to activate / deactivate

Code diagnostics, highly recommended

Arithmetic operations

  • +: addition
  • -: subtraction
  • *: multiplication
  • /: division
  • ^ or **: exponentiation
  • %%: modulo (remainder after division)
  • %/%: integer division

Remember that R will:

  • first perform exponentiation
  • then multiplications and/or divisions
  • and finally additions and/or subtractions.

prioritization

change the priority in evaluation:

  • parentheses ( and ) to group calculations

Using library()

ensure function’ origin

with only base loaded

x <- 1:10
filter(x, rep(1, 3))
Time Series:
Start = 1 
End = 10 
Frequency = 1 
 [1] NA  6  9 12 15 18 21 24 27 NA

Conflict: 2 packages export same function

with the same name, the latest loaded wins

library(dplyr)
Attaching package: 'dplyr'
The following objects are masked from 'package:stats':

    filter, lag
The following objects are masked from 'package:base':

    intersect, setdiff, setequal, union
filter(x, rep(1, 3))
Error in UseMethod("filter_"): no applicable method for 'filter_' applied to an object of class "c('integer', 'numeric')"

Solution: use the :: operator to call functions from a specific package

stats::filter(x, rep(1, 3))
Time Series:
Start = 1 
End = 10 
Frequency = 1 
 [1] NA  6  9 12 15 18 21 24 27 NA

Data types and structures

R base

Getting started

Let’s get ready to use R and RStudio

Do the following

  • Open up RStudio
  • Maximize the RStudio window
  • Click the Console pane, at the prompt (>) type in 3 + 2 and hit enter
> 3 + 2

4 main types

mode()

Type Example
numeric integer (2), double (2.34)
character (strings) ‘tidyverse!’
boolean TRUE / FALSE
complex 2+0i

in the console

2L
[1] 2
typeof(2L)
[1] "integer"
mode(2L)
[1] "numeric"
2.34
[1] 2.34
typeof(2.34)
[1] "double"
"tidyverse!"
[1] "tidyverse!"
TRUE
[1] TRUE
2+0i
[1] 2+0i

Special case

NA   # not available, missing data
NA_real_
NA_integer_
NA_character_
NA_complex_
NULL # empty
-Inf/Inf # infinite values
NaN # Not a Number

Structures

Vectors

c() is the function for concatenate

4
c(43, 5.6, 2.90)
[1] 4
[1] 43.0  5.6  2.9

Factors

convert strings to factors, levels is the dictionary

factor(c("AA", "BB", "AA", "CC"))
[1] AA BB AA CC
Levels: AA BB CC

Lists

very important as it can contain anything

list(f = factor(c("AA", "AA")),
     v = c(43, 5.6, 2.90),
     s = 4L)
$f
[1] AA AA
Levels: AA

$v
[1] 43.0  5.6  2.9

$s
[1] 4

Data frames are special lists

data.frame

same as list but where all objects must have the same length

Example, 3 elements of same size

data.frame(
  f = factor(c("AA", "AA", "BB")),
  v = c(43, 5.6, 2.90),
  s = rep(4, 3))
   f    v s
1 AA 43.0 4
2 AA  5.6 4
3 BB  2.9 4

Example, missing one element in v

data.frame(
  f = factor(c("AA", "AA", "BB")),
  v = c(43, 5.6),
  s = rep(4, 3))
Error in data.frame(f = factor(c("AA", "AA", "BB")), v = c(43, 5.6), s = rep(4, : arguments imply differing number of rows: 3, 2

Concatenate atomic elements

i.e build a vector

collection of simple things

  • things are the smallest elements: atomic
  • must be of same mode: automatic coercion
  • indexed, from 1 to length(vector)
  • created with the c() function
c(2, TRUE, "a string")
[1] "2"        "TRUE"     "a string"

assignment operator, create object

operator is <-, associate a name to an object

my_vec <- c(3, 4, 1:3)
my_vec
[1] 3 4 1 2 3

Tip

Rstudio has the built-in shortcut Alt+- for <-

hierarchy

source: H. Wickham - R for data science, licence CC

in console

is.vector(c("a", "c"))
[1] TRUE
mode(c("a", "c"))
[1] "character"
is.vector(list(a = 1))
[1] TRUE
is.atomic(list(a = 1))
[1] FALSE
is.data.frame(list(a = 1))
[1] FALSE

Vectors

subsetting

important

Unlike python or Perl, vectors use 1-based index!!

: operator

generate integer sequence

3:10
[1]  3  4  5  6  7  8  9 10

How to extract > 1 element

select elements from position 3 to 10:

LETTERS[3:10]
[1] "C" "D" "E" "F" "G" "H" "I" "J"

break in sequence

LETTERS[c(2:5, 7)]
[1] "B" "C" "D" "E" "G"

negative selection

LETTERS[-(2:21)]
[1] "A" "V" "W" "X" "Y" "Z"

Vectorized operation

one of the best R feature

my_vec <- 1:8
my_vec
[1] 1 2 3 4 5 6 7 8
my_vec + 2
[1]  3  4  5  6  7  8  9 10

try this one

my_vec <- 1:8
my_vec / 2

and this one

my_vec + 1:4

answers

my_vec / 2
[1] 0.5 1.0 1.5 2.0 2.5 3.0 3.5 4.0
my_vec + 1:4
[1]  2  4  6  8  6  8 10 12

Hexbins

After David Robinson’ laptop, see and get inspired!

Hadley Wickham

Bob Rudis